Study 03
Before anyone announces a price, the land is already bought.
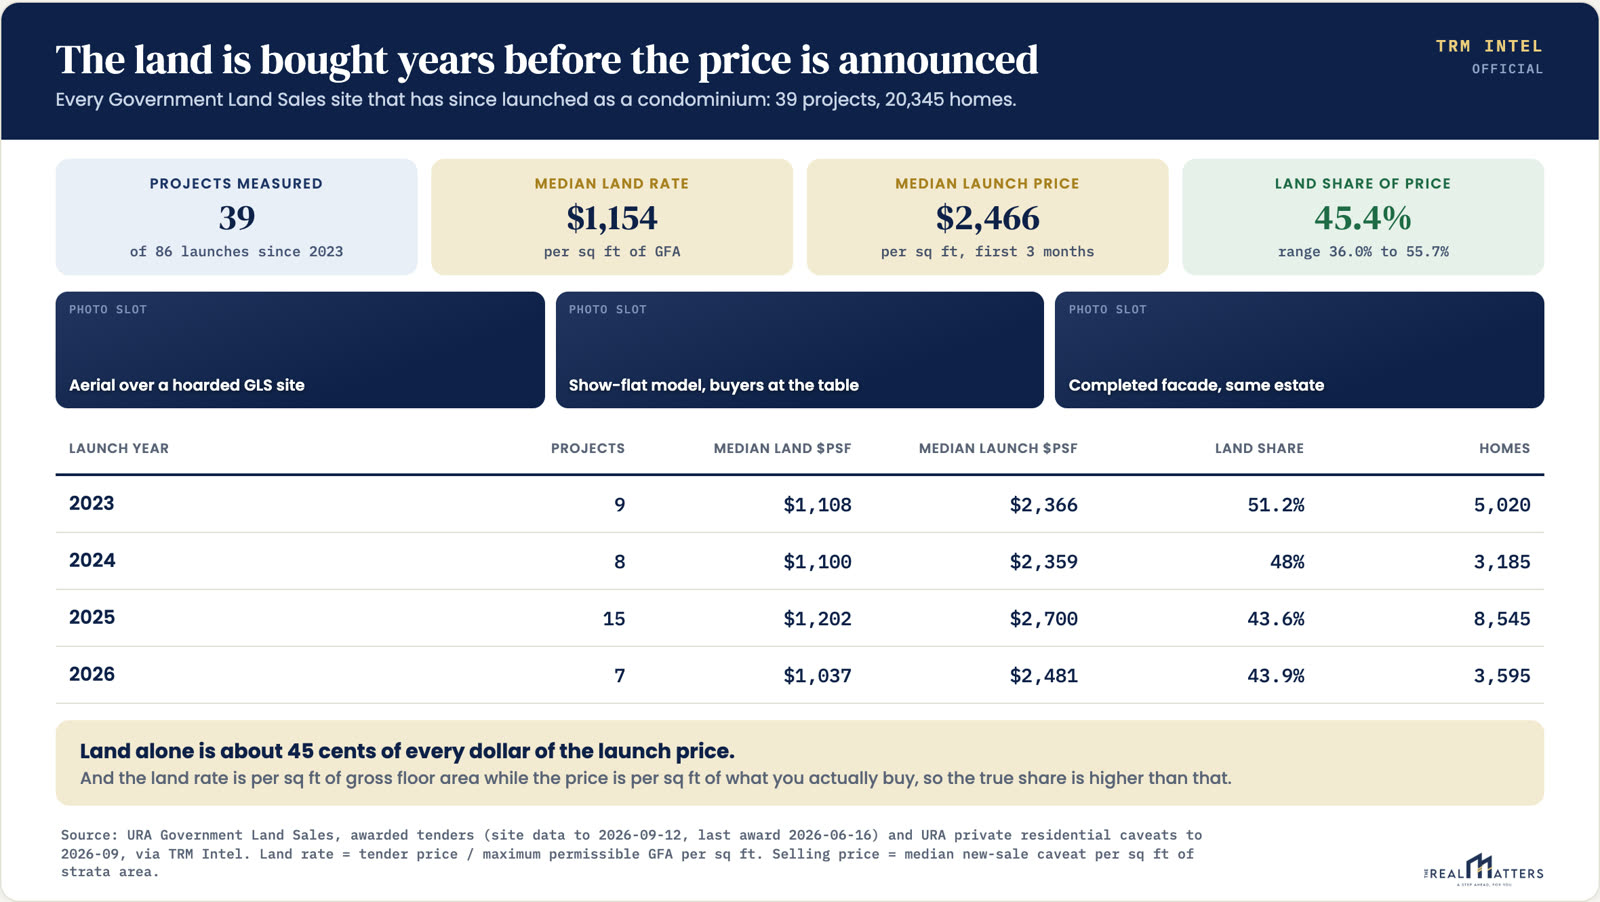
Government land sale tender results matched to the projects actually built on them, plus every site already paid for that has not launched yet. 39 matched sites, read one by one rather than joined by distance alone.
The finding
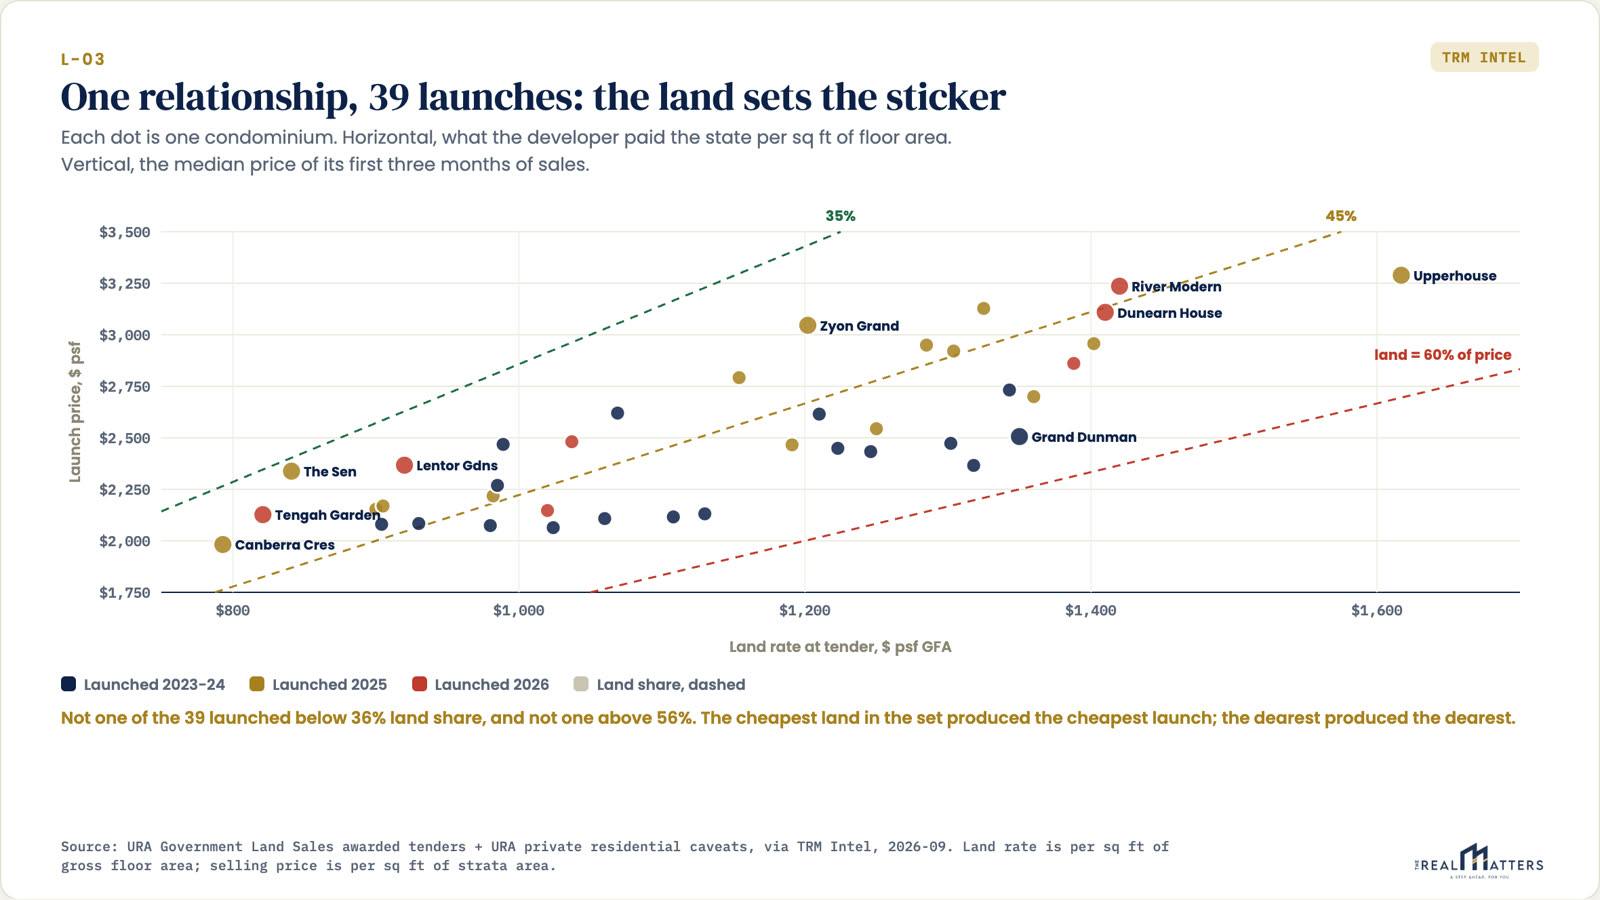
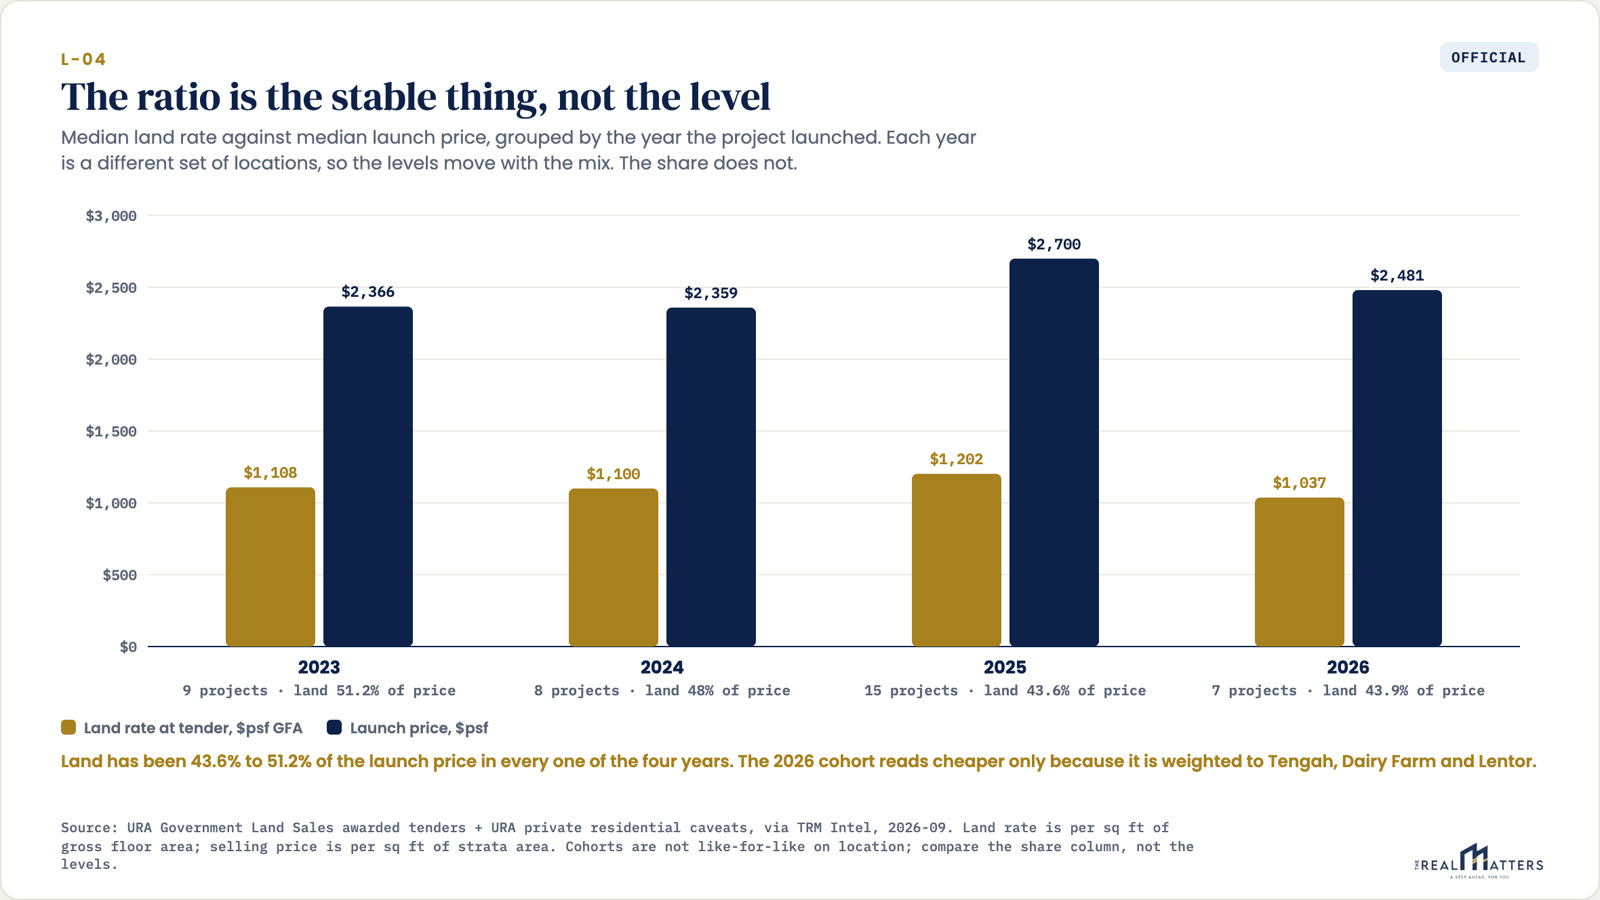
Land is about 45 cents of every dollar of the launch price. The median across 39 projects is 45.4 percent, in a range of 36 to 56 percent, and it has sat between 43.6 and 51.2 percent in each of the last four launch years. The true share is higher still, because the land rate is per square foot of gross floor area while the launch price is per square foot of what a buyer actually receives.
Why it matters to a buyer
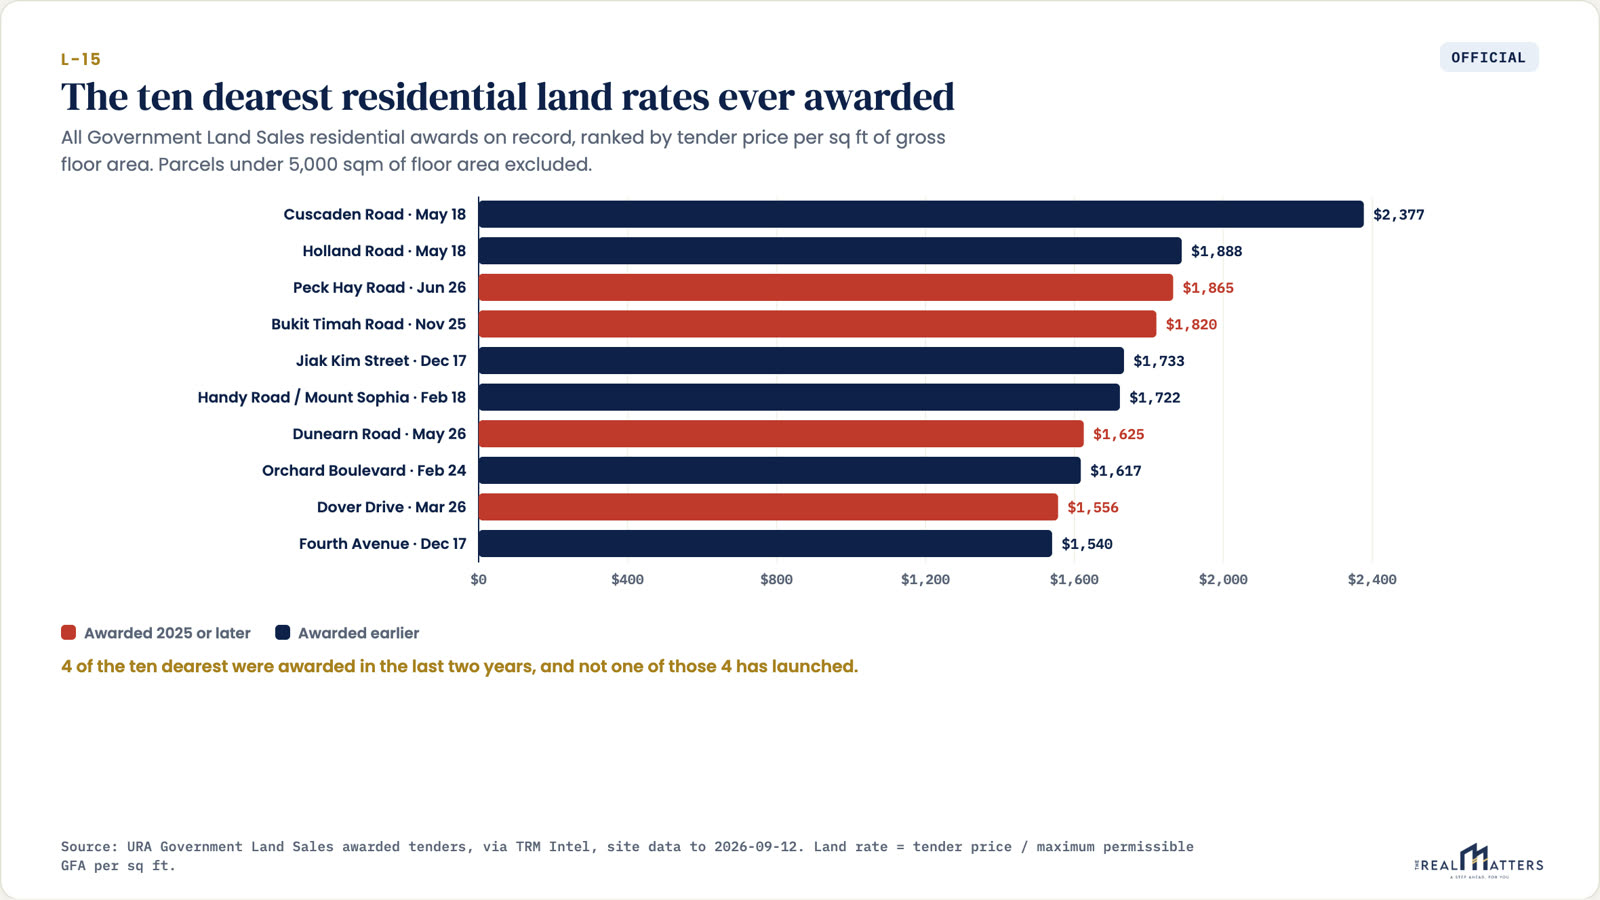
It means the answer to "why is this launch priced here" is usually settled years before the showflat opens. The cheapest land in the set, Tengah Garden Avenue at 821 psf, produced the cheapest launch in the set. The dearest, Orchard Boulevard at 1,617, produced the dearest. The land price arrives first and the asking price follows it.
The part nobody mentions
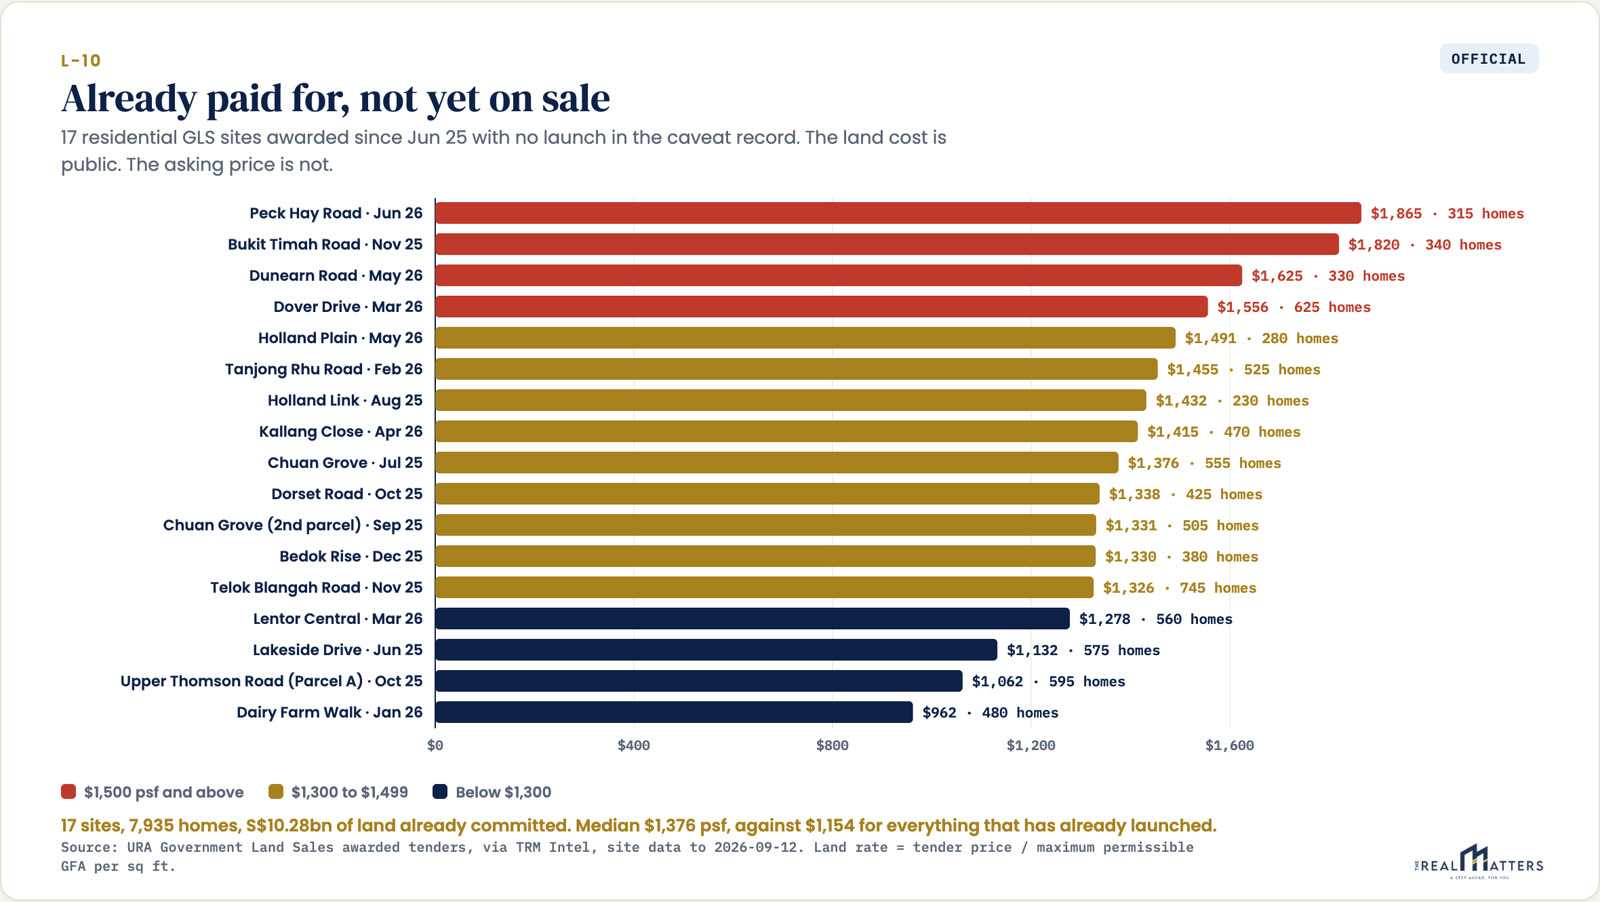
2026 land is the dearest on record at the median, 1,473 psf of gross floor area, 30 percent above 2022. Not one of the eight 2026 awards has launched. Seventeen awarded sites, 7,935 homes and 10.28 billion dollars of land are currently sitting between the tender and the showflat.
The trap in the method
Government land sales give a street name, never a project name, so the link has to be derived. Matching on distance alone produced ten confident false matches to collective sale redevelopments sitting near an old parcel. The rule that fixed it: the project centre within 300 metres, first sold after the award and within 60 months of it, and no transaction history before its first new sale. Every link was then read by eye. Distance alone is not enough, and anyone showing you this analysis without that step is showing you noise.
The limits
What this pack deliberately does not do.
01.
It never estimates a launch price on an official card. No developer has announced a price for any site that has not launched, and a number nobody has announced does not belong on a chart presented as fact.
02.
It does not treat a nearby parcel as a match. Ten plausible looking matches were rejected on inspection. The join is 300 metres, after the award, within 60 months, no prior transaction history, then read by eye.
03.
It does not tell you a launch is overpriced. It tells you what the land cost and what that has historically implied. What a specific project is worth to you is a separate question with your numbers in it.
Where these numbers come from
Computed from URA government land sale tender results and URA caveat records, 39 matched sites, pulled 12 September 2026. URA restates caveats for weeks after a month closes. Past transactions are not a forecast. Nothing here is financial advice.