Study 01
The price you pay on day one decides more than anything else.
Tested on matched buy-and-sell pairs, meaning the same unit bought and later sold, so every row is one owner's real outcome rather than a point on an index. 13,732 private non-landed pairs and 99,705 HDB pairs.
The finding
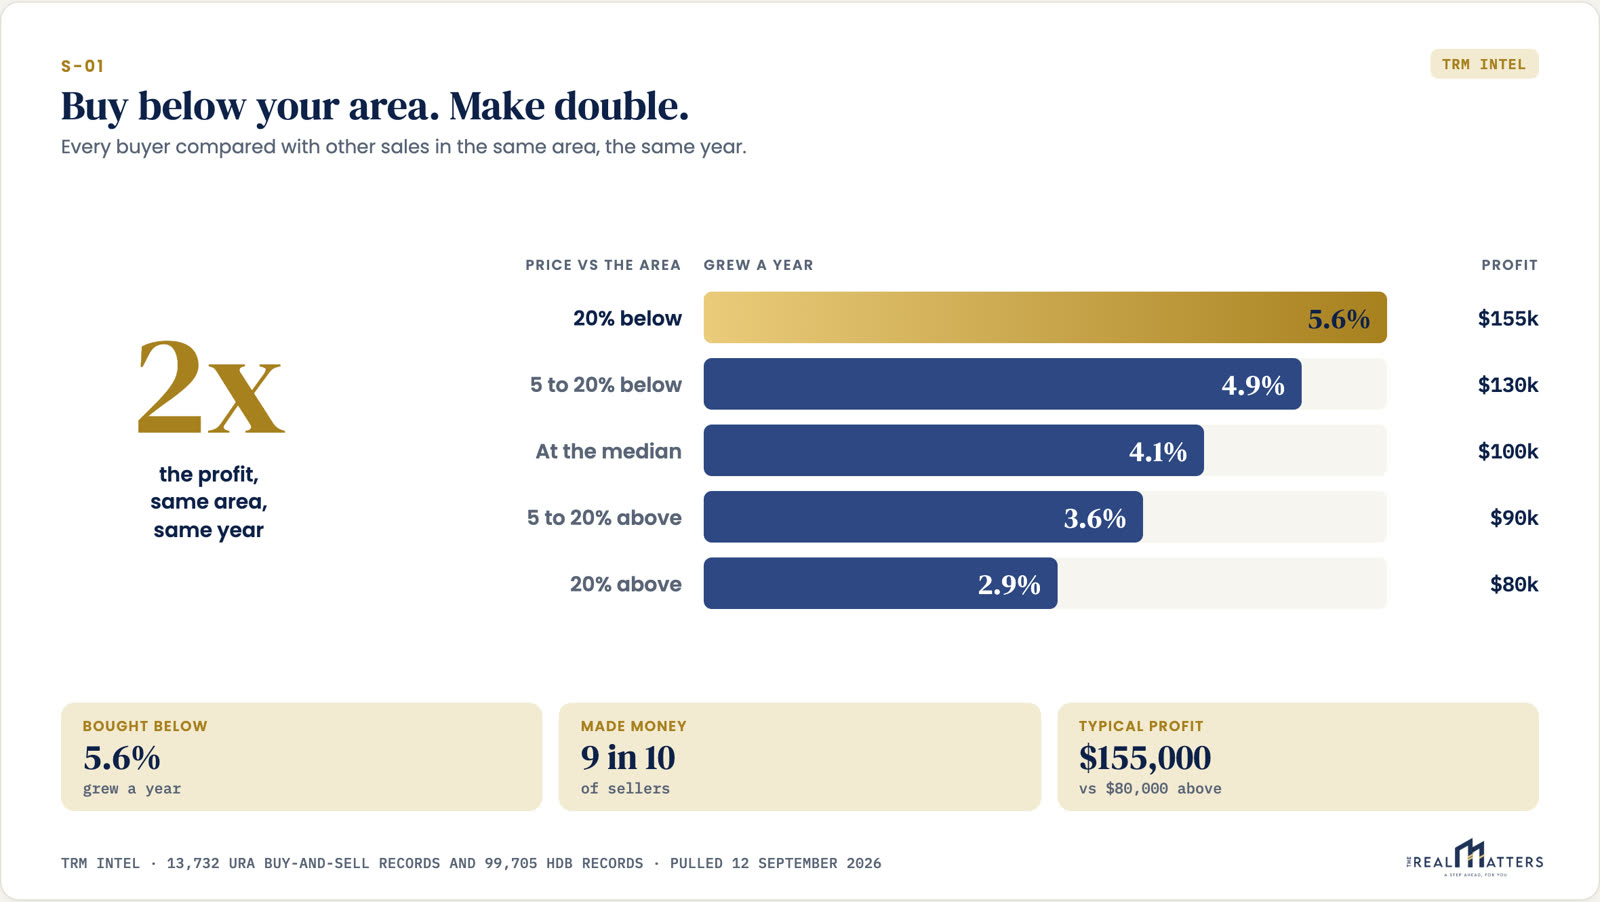
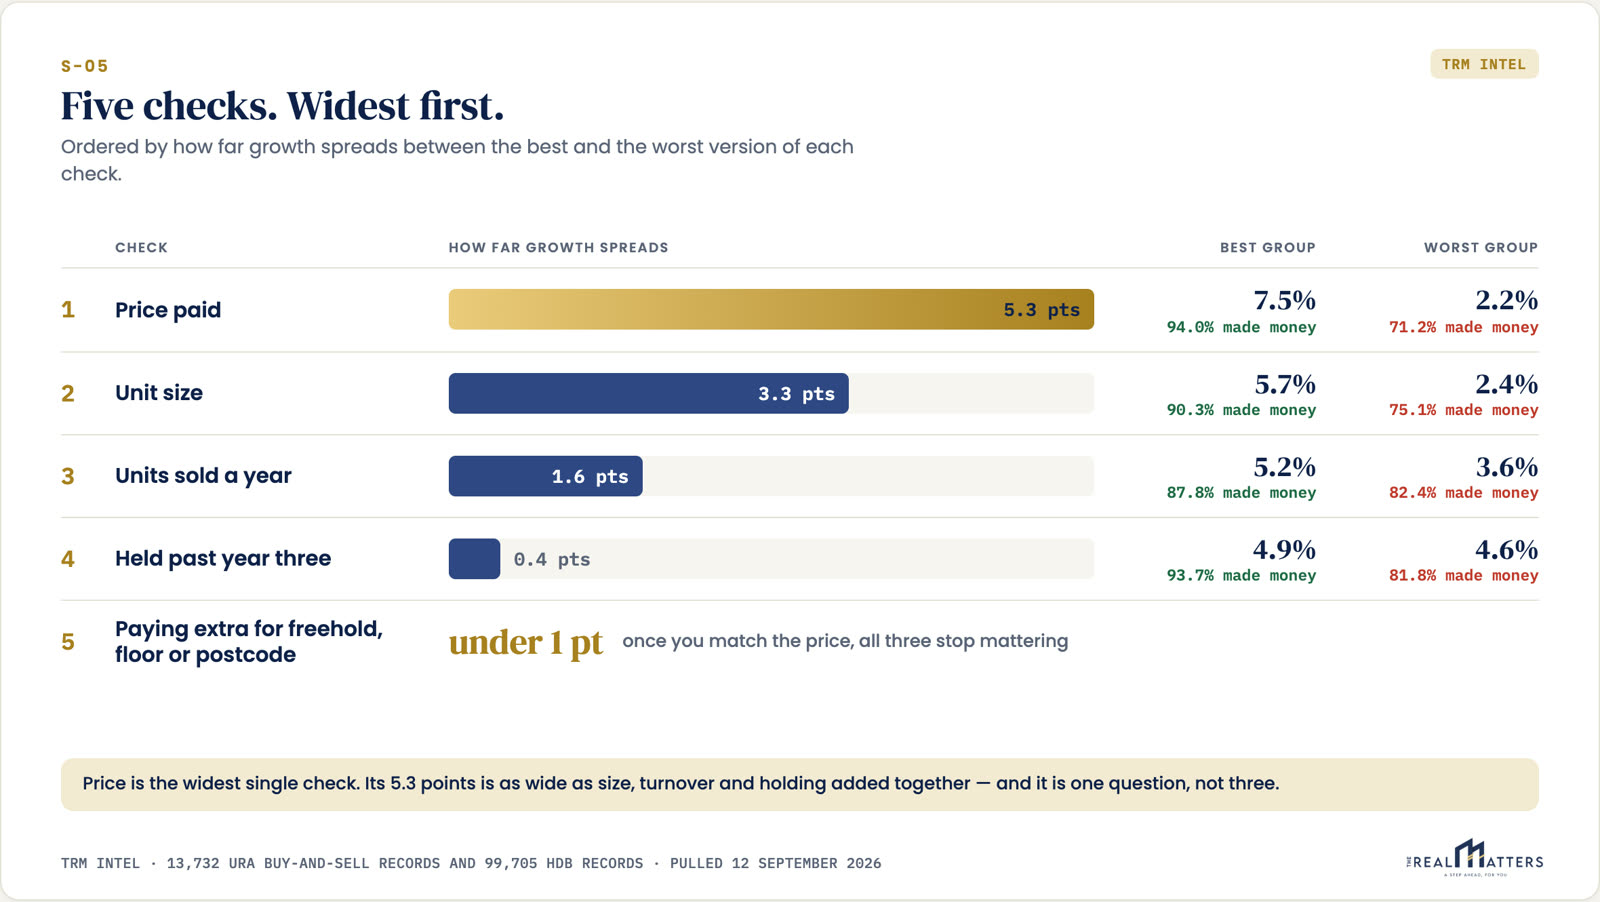
Split the record into five bands by what the buyer paid relative to the median psf of the same district in the same year, and growth moves in one direction the whole way down. More than 20 percent below: 5.6 percent a year, 88.4 percent made money, typical profit 155,000 dollars. More than 20 percent above: 2.9 percent a year and 79.0 percent. It replicates three independent ways, across all private resale, inside each of the three market segments separately, and again on HDB pairs held five years or more.
What stopped mattering
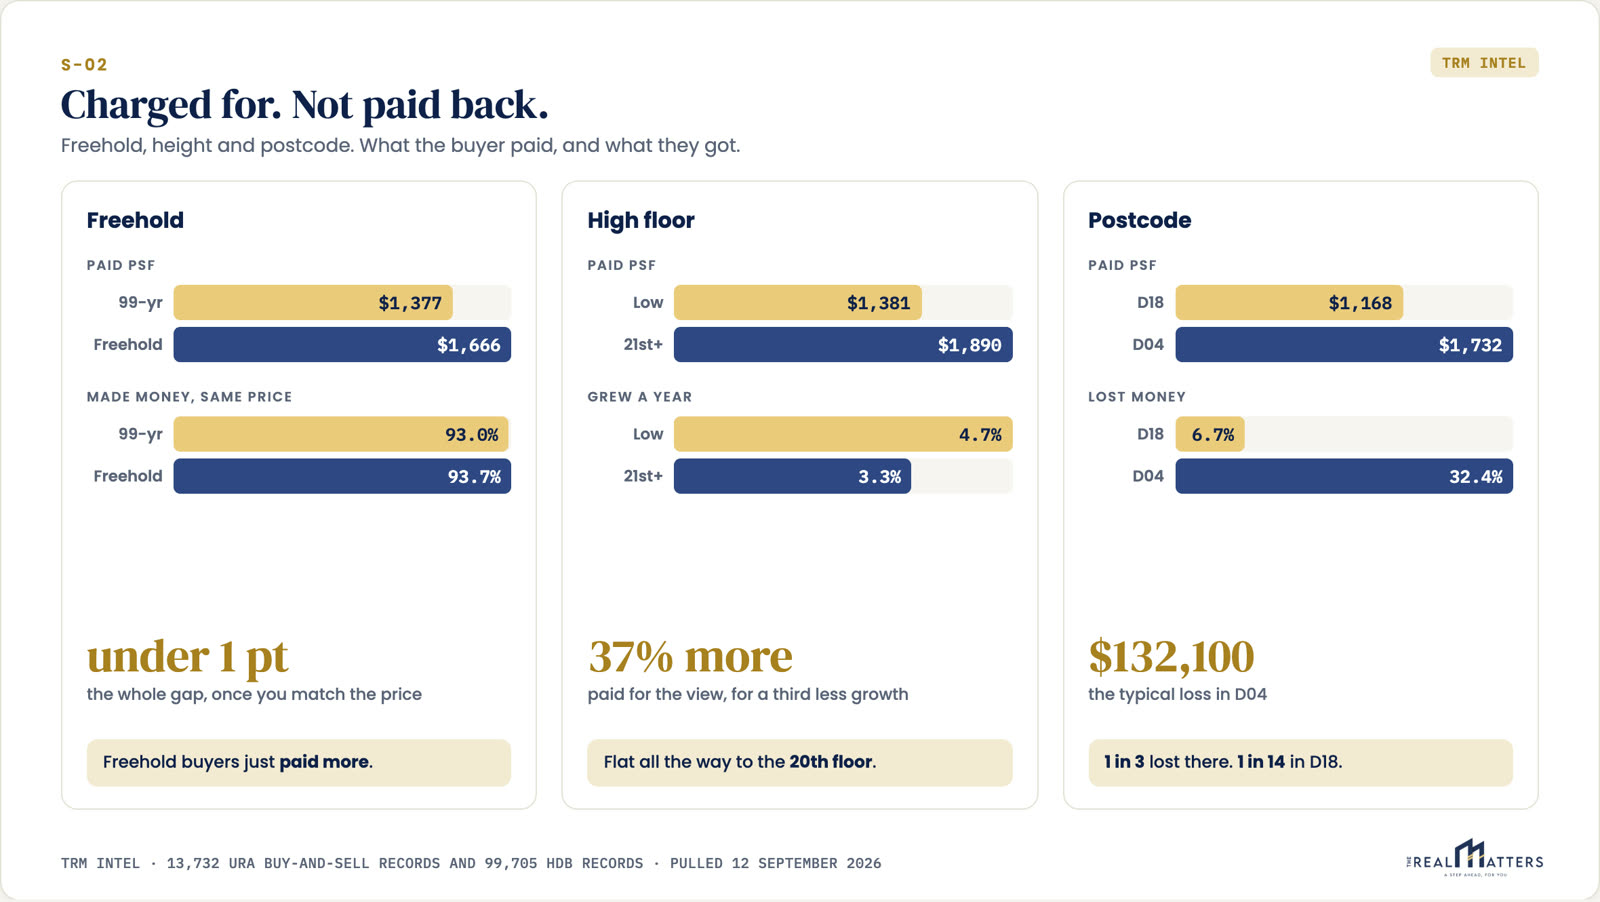
Freehold, high floor, prime postcode and large unit size all went flat or slightly negative once entry price was held still. Raw numbers say 99 year leases beat freehold, 5.1 percent against 3.7. That is not a tenure finding. Those units simply went in cheaper, 1,377 psf against 1,666. Hold price still and the gap collapses to under a point, and freehold wins the win rate in every band. Neither of the two standard pitches survives the test.
The weakest cell, said out loud
The priciest third of city-centre resale returned 0.6 percent a year with a 55.5 percent win rate across 723 pairs. That is close to a coin flip, and it is the corner of this dataset I would want to know about if I were the one buying.
The limits
Three claims this data cannot support.
01.
Million dollar flats being the best performers. There are 56 of them bought and sold again. They look excellent, 4.7 percent and 98 out of 100, but that is one group who bought before 2020 and sold into the strongest HDB market on record. Fifty six is a story, not proof, and it is not used here.
02.
A twenty year private record. These private caveats start in June 2021, so every private figure describes one rising market. The long record is HDB only, back to 1990. Blending them and calling it one thing would be dishonest.
03.
"Buy cheap and you win." That is not the finding. The finding is cheap relative to the same district in the same year. Plenty of units are cheap for a very good reason, and the job is working out whether the discount is larger than the reason. No chart does that part for you.
Where these numbers come from
Computed from URA caveat data and the HDB resale register. 13,732 private non-landed resale pairs and 99,705 HDB pairs, caveats June 2021 to September 2026, pulled 12 September 2026. URA restates caveats for weeks after a month closes, so these figures move. Past transactions describe what happened to other owners and are not a forecast for any particular unit. Nothing here is financial advice.